Note
Go to the end to download the full example code.
Sampling Sequences of Dominated and Nondominated Points#
This example illustrates how to sample sequences of multi-dimensional points with various dominance properties using generate_sequence().
First we define a few functions useful for plotting.
import moocore
import numpy as np
import matplotlib.pyplot as plt
import plotly.graph_objects as go
from plotly.subplots import make_subplots
from matplotlib.patches import Arc
from matplotlib.colors import to_hex


def plot_3d(what, x, title, plotly=False, show_index=False):
    """Scatter plot of 3D points."""
    if not plotly:
        fig = plt.figure()
        ax = fig.add_subplot(projection="3d")

    ranks = moocore.pareto_rank(x)
    n_ranks = ranks.max() + 1

    # One distinct color for each rank
    cmap = plt.get_cmap("viridis", n_ranks)
    rank_colors = [to_hex(cmap(i)) for i in range(n_ranks)]

    match what:
        case "simplex":
            # Standard 2-simplex vertices in 3D
            x_s, y_s, z_s = np.eye(3, dtype=int)
            if plotly:
                surface = go.Mesh3d(
                    x=x_s,
                    y=y_s,
                    z=z_s,
                    i=[0],
                    j=[1],
                    k=[2],
                    color="cyan",
                    opacity=0.2,
                    flatshading=True,
                    name="Simplex",
                    hoverinfo="none",
                )
            else:
                ax.plot_trisurf(
                    x_s,
                    y_s,
                    z_s,
                    triangles=[[0, 1, 2]],
                    color="cyan",
                    alpha=0.2,
                    edgecolor="gray",
                )

        case "concave" | "convex":
            # Generate points on the positive orthant of the sphere.
            phi = np.linspace(0, np.pi / 2, 50)
            theta = np.linspace(0, np.pi / 2, 50)
            phi, theta = np.meshgrid(phi, theta)
            # Convert spherical to Cartesian coordinates (unit sphere)
            x_s = np.sin(phi) * np.cos(theta)
            y_s = np.sin(phi) * np.sin(theta)
            z_s = np.cos(phi)

            if what == "convex":
                x_s = 1 - x_s
                y_s = 1 - y_s
                z_s = 1 - z_s

            if plotly:
                surface = go.Surface(
                    x=x_s,
                    y=y_s,
                    z=z_s,
                    colorscale=[[0, "cyan"], [1, "cyan"]],
                    opacity=0.2,
                    showscale=False,
                    name="Surface",
                )
            else:
                ax.plot_surface(
                    x_s, y_s, z_s, color="cyan", alpha=0.2, edgecolor="gray"
                )

        case _:
            raise ValueError(f"Unknown plot type {what}")

    if plotly:
        scatter = go.Scatter3d(
            x=x[:, 0],
            y=x[:, 1],
            z=x[:, 2],
            mode="markers+text" if show_index else "markers",
            text=[str(i + 1) for i in range(len(x))],
            textposition="top center",
            marker=dict(size=2, color=[rank_colors[r] for r in ranks]),
        )

        if x.max() <= 1:
            limits = [0, 1]
        else:
            limits = [x.min(), x.max()]
        layout = go.Layout(
            title=title,
            scene=dict(
                xaxis=dict(title="X", range=limits),
                yaxis=dict(title="Y", range=limits),
                zaxis=dict(title="Z", range=limits),
                # Approx. elev=30, azim=25
                camera=dict(eye=dict(x=1.2, y=1.2, z=0.8)),
            ),
            margin=dict(l=0, r=0, b=0, t=40),
            showlegend=False,
        )
        fig = go.Figure(data=[surface, scatter], layout=layout)
    else:
        ax.scatter(
            x[:, 0],
            x[:, 1],
            x[:, 2],
            color="blue",
            s=20,
            marker="o",
            depthshade=False,
        )
        ax.set(
            xlabel="X",
            ylabel="Y",
            zlabel="Z",
            xlim=(0, 1),
            ylim=(0, 1),
            zlim=(0, 1),
            title=title,
        )
        ax.view_init(elev=30, azim=25)

    return fig


def plotly_3d(what, x, title, show_index=False):
    """Scatter plot of 3D points using plotly."""
    return plot_3d(
        what=what, x=x, title=title, plotly=True, show_index=show_index
    )


def plotly_3d_side_by_side(fig1, fig2):
    """Show two plotly 3D figures side-by-side."""
    fig = make_subplots(
        rows=1,
        cols=2,
        specs=[[{"type": "scene"}, {"type": "scene"}]],
        subplot_titles=(fig1.layout.title.text, fig2.layout.title.text),
    )
    len1 = len(fig1.data)
    fig.add_traces(fig1.data, rows=[1] * len1, cols=[1] * len1)
    len2 = len(fig2.data)
    fig.add_traces(fig2.data, rows=[1] * len2, cols=[2] * len2)
    fig.update_layout(
        height=400, title="", margin=dict(l=0, r=0, b=0, t=40), showlegend=False
    )
    fig.update_scenes(fig1.layout.scene.to_plotly_json())
    return fig


def plot_sequence_2d(points, title, ax, show_index=True, show_circle=False):
    """Plot a sequence in 2D"""
    ranks = moocore.pareto_rank(points)
    n_ranks = ranks.max() + 1

    ax.scatter(
        points[:, 0],
        points[:, 1],
        c=ranks,
        cmap=plt.get_cmap("viridis", n_ranks),
        vmin=-0.5,
        vmax=n_ranks - 0.5,
    )

    if show_index:
        for i, (x, y) in enumerate(points):
            ax.text(x, y, str(i + 1), fontsize=10, ha="left", va="bottom")

    if show_circle:
        radius = 1 if points.max() <= 1 else 2**31
        ax.add_patch(
            Arc(
                (0, 0),
                2 * radius,
                2 * radius,
                theta1=0,
                theta2=90,
                fill=False,
                linewidth=1.5,
                linestyle="--",
            )
        )

    if points.min() >= 0 and points.max() <= 1:
        ax.set_xlim(0, 1.05)
        ax.set_ylim(0, 1.05)

    ax.set_title(title)
    ax.set_xlabel("X")
    ax.set_ylabel("Y")
    ax.grid(True)
Sequences in 2D#
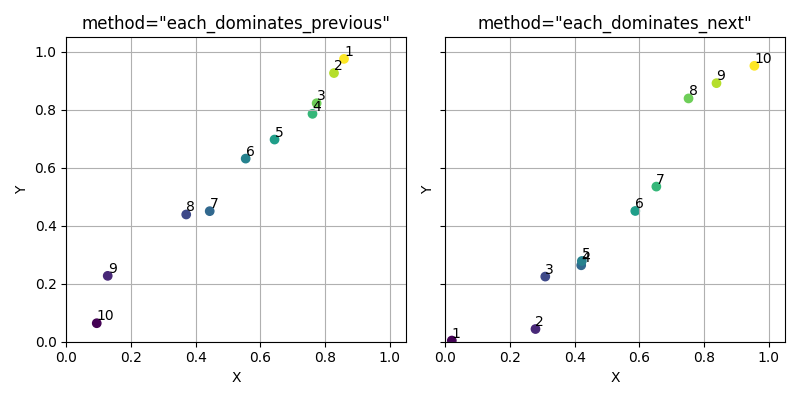
First, we plot completely ordered sequences. We use different seeds to get different sequences. Points are colored according to their Pareto rank, with lower ranks having darker colors. In these two sequences, each point has a different color (rank) from the rest.
n = 10
fig, axes = plt.subplots(1, 2, figsize=(8, 4), sharex=True, sharey=True)
for ax, method, seed in zip(
    axes, ["each_dominates_previous", "each_dominates_next"], [42, 43]
):
    points = moocore.generate_sequence(n, 2, method=method, seed=seed)
    plot_sequence_2d(points, title=f'method="{method}"', ax=ax)

fig.tight_layout()
plt.show()
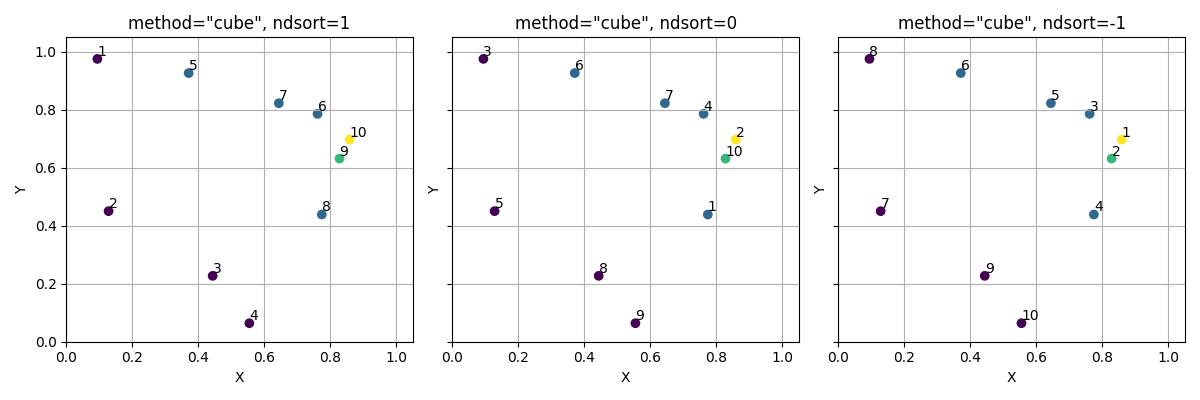
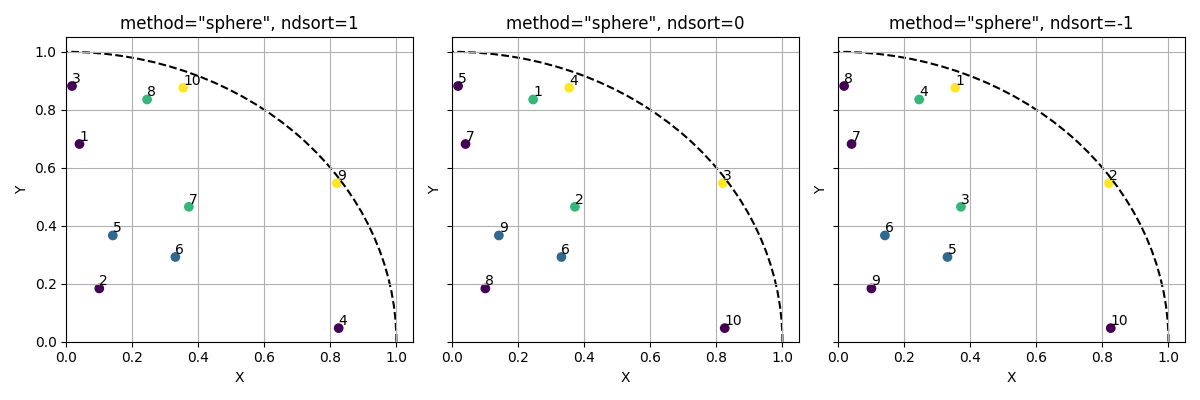
Random sequences sampled in the unit hypercube or the unit hypersphere.
n = 10
for method in ["cube", "sphere"]:
    fig, axes = plt.subplots(1, 3, figsize=(12, 4), sharex=True, sharey=True)
    show_circle = method == "sphere"
    for ax, ndsort in zip(axes, [1, 0, -1]):
        points = moocore.generate_sequence(
            n, 2, method=method, ndsort=ndsort, seed=42
        )
        plot_sequence_2d(
            points,
            title=f'method="{method}", ndsort={ndsort}',
            ax=ax,
            show_circle=show_circle,
        )

    fig.tight_layout()
    plt.show()
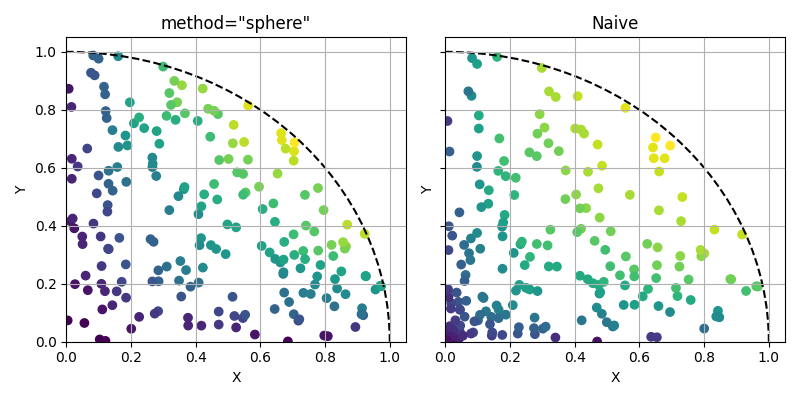
Naive sampling within the hypersphere produces a bias towards the origin.
n = 200
method = "sphere"
fig, axes = plt.subplots(1, 2, figsize=(8, 4), sharex=True, sharey=True)
points = moocore.generate_sequence(n, 2, method=method, seed=42)
plot_sequence_2d(
    points,
    title=f'method="{method}"',
    ax=axes[0],
    show_circle=True,
    show_index=False,
)

# Naive
rng = np.random.default_rng(42)
points = np.abs(rng.normal(size=(n, 2)))
points /= np.linalg.norm(points, axis=1, keepdims=True)
points *= rng.uniform(0, 1, size=(n, 1))
plot_sequence_2d(
    points, title="Naive", ax=axes[1], show_circle=True, show_index=False
)
fig.tight_layout()
plt.show()
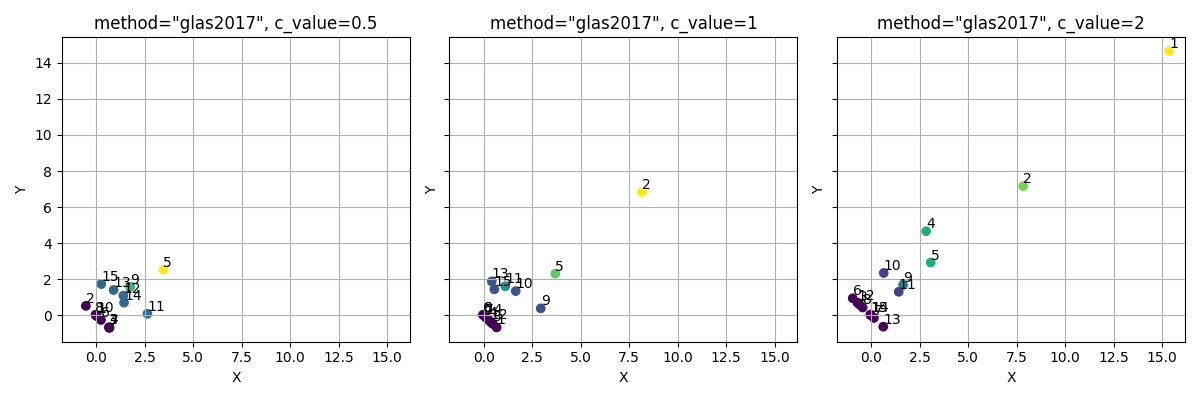
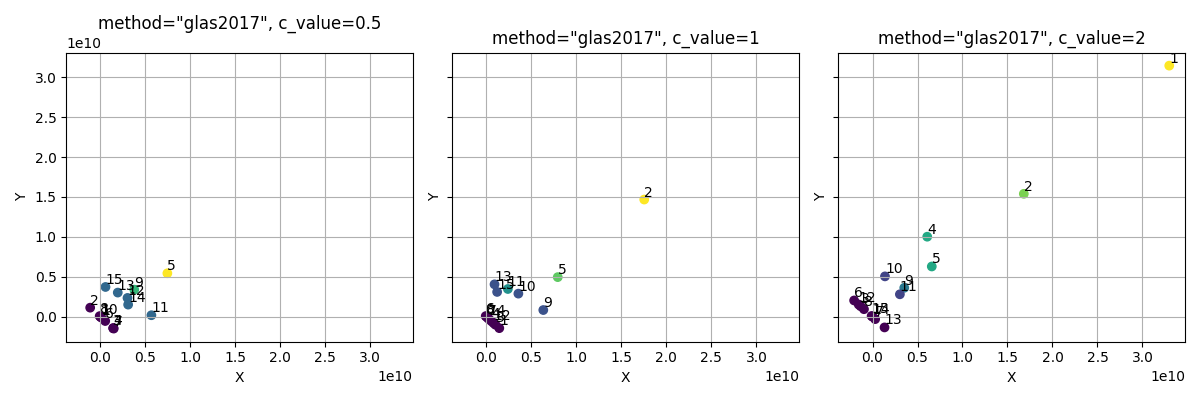
Generate the analytic sequence proposed by Glasmachers[21].
n = 15
method = "glas2017"
fig, axes = plt.subplots(1, 3, figsize=(12, 4), sharex=True, sharey=True)
for ax, c_value in zip(axes, [0.5, 1, 2]):
    points = moocore.generate_sequence(
        n, 2, method=method, c_value=c_value, seed=42
    )
    plot_sequence_2d(
        points, title=f'method="{method}", c_value={c_value}', ax=ax
    )

fig.tight_layout()
plt.show()
Sequences in integer space#
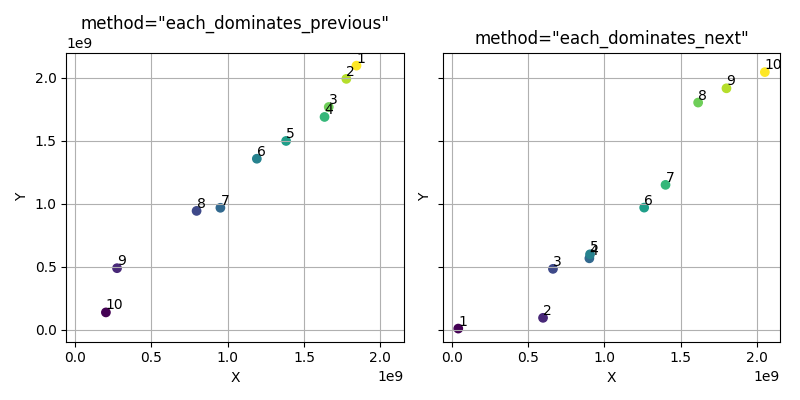
We can also generate points in integer space.
n = 10
fig, axes = plt.subplots(1, 2, figsize=(8, 4), sharex=True, sharey=True)
for ax, method, seed in zip(
    axes, ["each_dominates_previous", "each_dominates_next"], [42, 43]
):
    points = moocore.generate_sequence(
        n, 2, method=method, seed=seed, integer=True
    )
    plot_sequence_2d(points, title=f'method="{method}"', ax=ax)

fig.tight_layout()
plt.show()

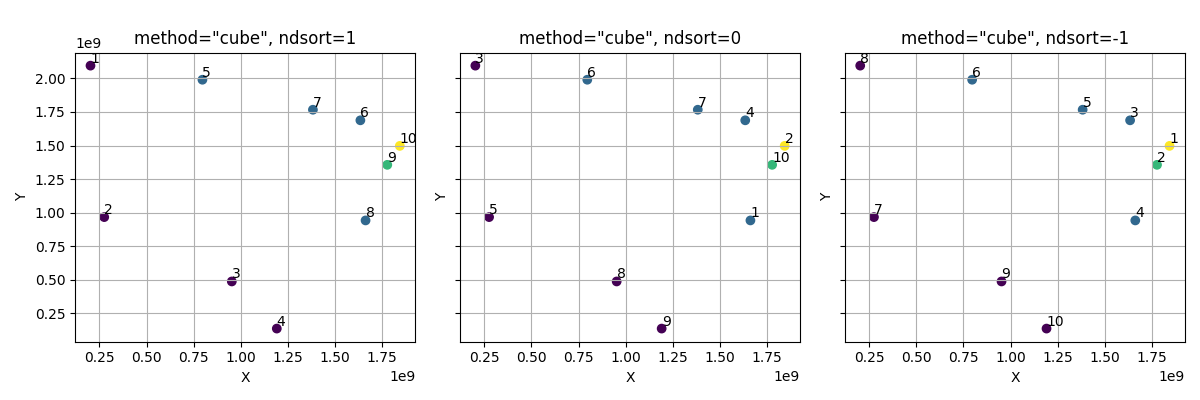
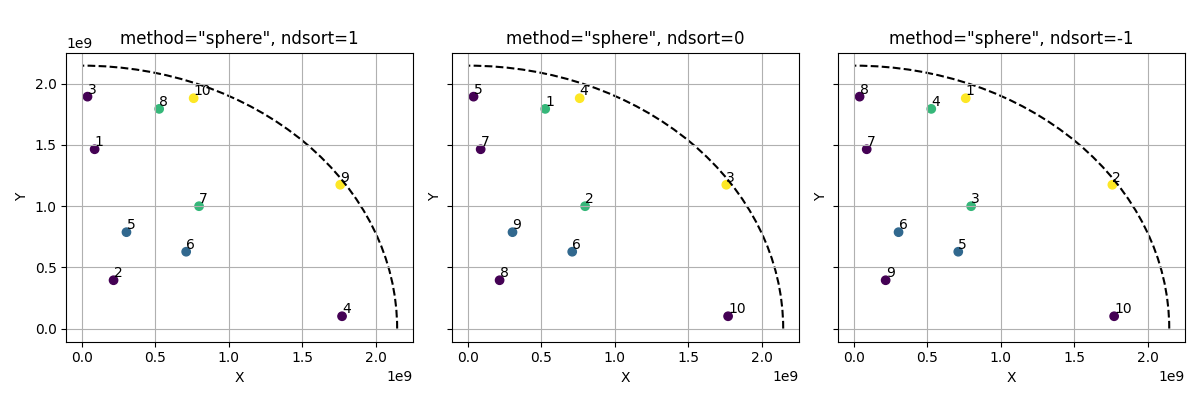
for method in ["cube", "sphere"]:
    fig, axes = plt.subplots(1, 3, figsize=(12, 4), sharex=True, sharey=True)
    show_circle = method == "sphere"
    for ax, ndsort in zip(axes, [1, 0, -1]):
        points = moocore.generate_sequence(
            n, 2, method=method, ndsort=ndsort, seed=42, integer=True
        )
        plot_sequence_2d(
            points,
            title=f'method="{method}", ndsort={ndsort}',
            ax=ax,
            show_circle=show_circle,
        )

    fig.tight_layout()
    plt.show()

n = 15
method = "glas2017"
fig, axes = plt.subplots(1, 3, figsize=(12, 4), sharex=True, sharey=True)
for ax, c_value in zip(axes, [0.5, 1, 2]):
    points = moocore.generate_sequence(
        n, 2, method=method, c_value=c_value, seed=42, integer=True
    )
    plot_sequence_2d(
        points, title=f'method="{method}", c_value={c_value}', ax=ax
    )

fig.tight_layout()
plt.show()
Sequences in 3D#
Completely ordered sequences. We use different seeds to get different sequences. Points are colored according to their Pareto rank, with lower ranks having darker colors. In these two sequences, each point has a different color (rank) from the rest.
n = 10
method = "each_dominates_previous"
fig1 = plotly_3d(
    "simplex",
    moocore.generate_sequence(n, 3, method, seed=42),
    title=f'method="{method}"',
    show_index=True,
)
method = "each_dominates_next"
fig2 = plotly_3d(
    "simplex",
    moocore.generate_sequence(n, 3, method, seed=43),
    title=f'method="{method}"',
    show_index=True,
)

plotly_3d_side_by_side(fig1, fig2)
Random sequences sampled in the unit hypercube or the unit hypersphere. If you hover over a point, a tooltip shows the coordinates and the index of the point in the sequence.
n = 100
method = "cube"
fig1 = plotly_3d(
    "concave",
    moocore.generate_sequence(n, 3, method, seed=42),
    title=f'method="{method}"',
)
method = "sphere"
fig2 = plotly_3d(
    "concave",
    moocore.generate_sequence(n, 3, method, seed=42),
    title=f'method="{method}"',
)

plotly_3d_side_by_side(fig1, fig2)
Generate the analytic sequence proposed by Glasmachers[21].
n = 100
method = "glas2017"
c_value = 0.9
fig1 = plotly_3d(
    "simplex",
    moocore.generate_sequence(n, 3, method, seed=42, c_value=c_value),
    title=f'method="{method}", c_value={c_value}',
)
c_value = 1.1
fig2 = plotly_3d(
    "simplex",
    moocore.generate_sequence(n, 3, method, seed=42, c_value=c_value),
    title=f'method="{method}", c_value={c_value}',
)

plotly_3d_side_by_side(fig1, fig2)
Total running time of the script: (0 minutes 2.073 seconds)