Quality indicators#
Exact computation of hypervolume#
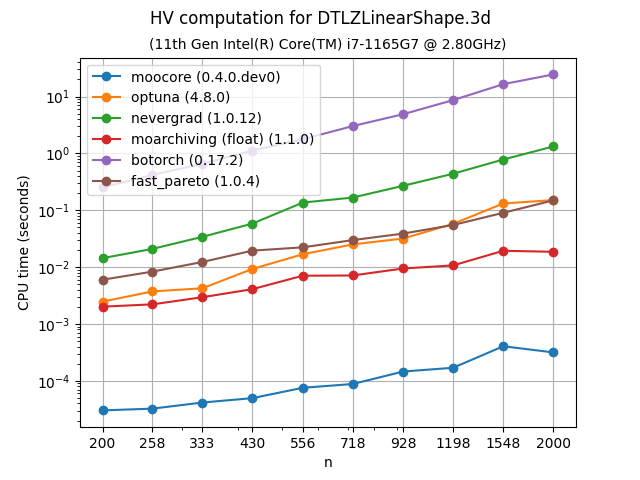
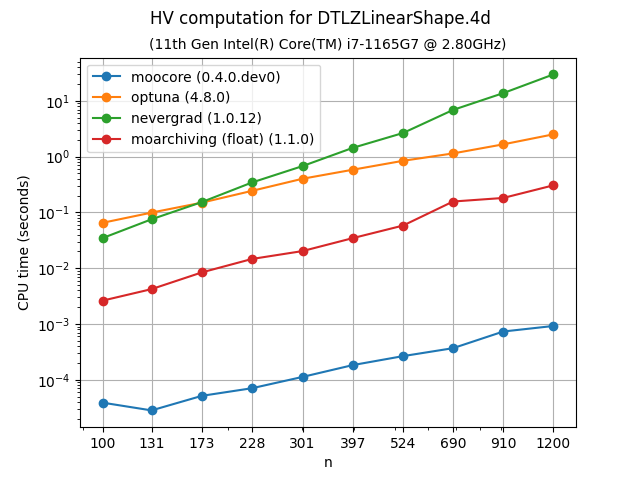
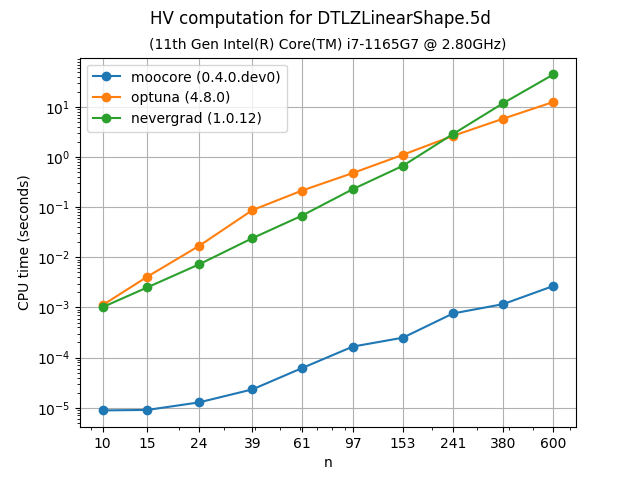
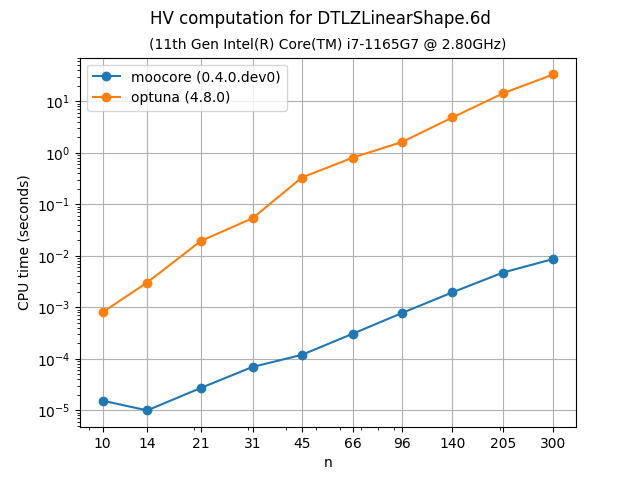
The following plots compare the speed of computing the hypervolume indicator in 3D, 4D, 5D and 6D. As the plots show, moocore is 100 times faster than the other packages and 1000 times faster than BoTorch and, by extension, Xopt and BoFire.
For 3D, Optuna uses a \(O(n^2)\) algorithm, while moocore uses the best-known \(O(n\log n)\) one, so the gap between the two will get significantly larger with a larger number of points than those tested here. moarchiving uses the same algorithms as moocore for 3D and 4D, but a pure Python implementation, so it is still 10-100 times slower than moocore’s C implementation. BoTorch and fast-pareto are not included for more than 3 objectives because they are tens of thousands of times slower than moocore.
Recent versions of DESDEO, DEAP (≥1.4.4), pymoo (≥0.6.1.6) and jMetalPy (≥1.9.0) already use moocore for hypervolume computation. The implementation in patatune appears to be wrong (cms-patatrack/patatune#52).
Approximation of the hypervolume#
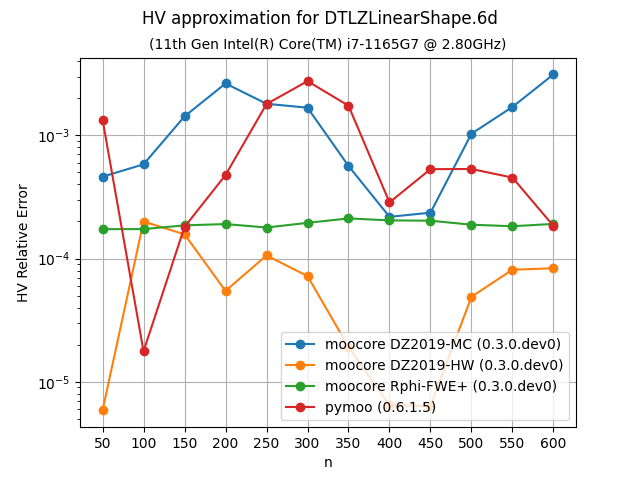
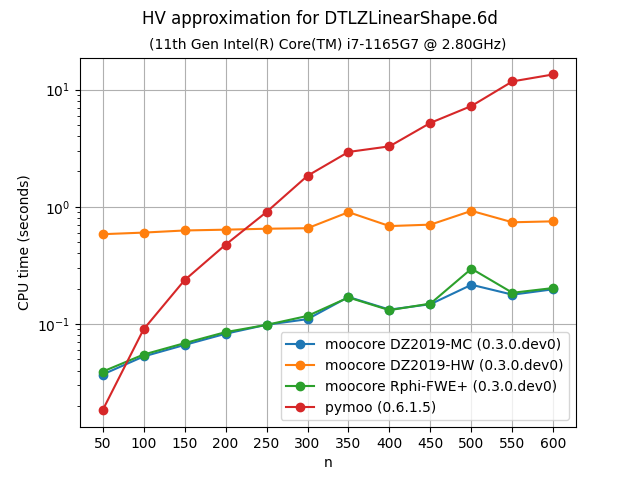
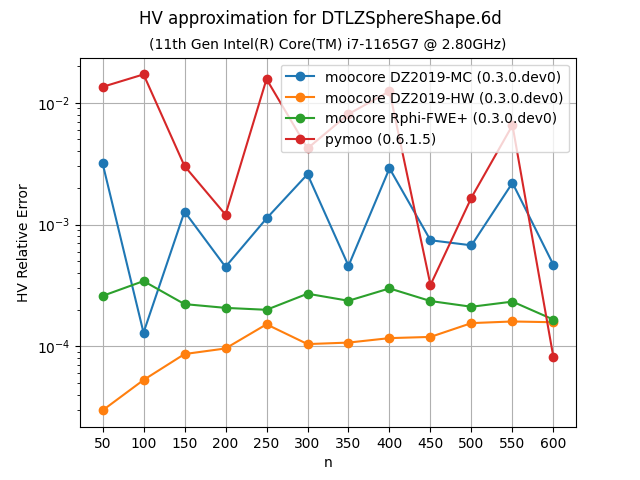
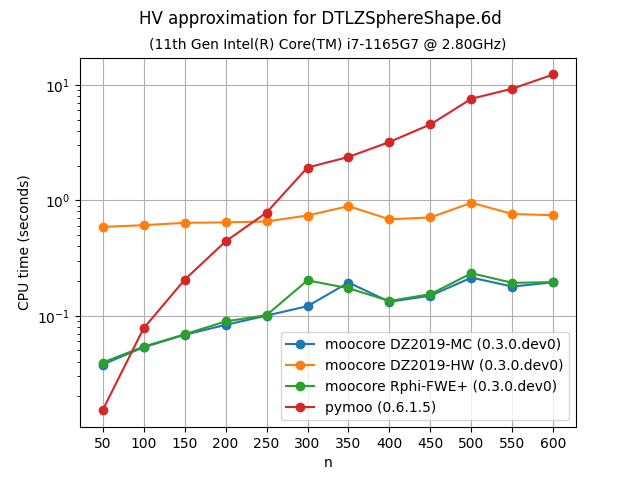
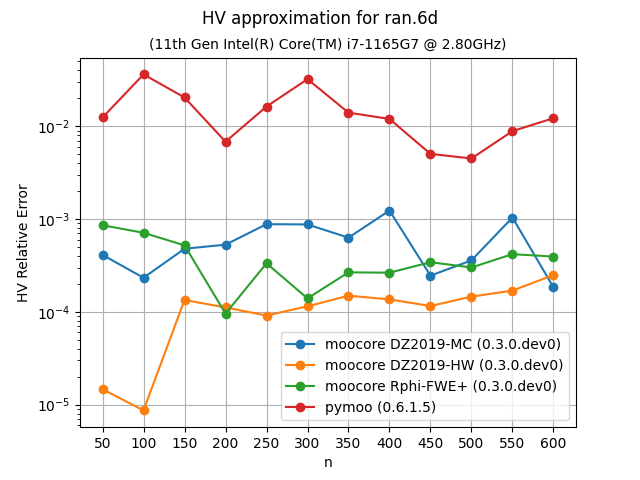
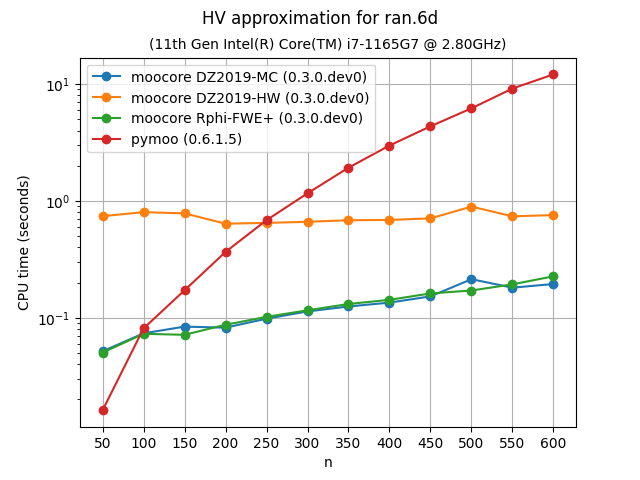
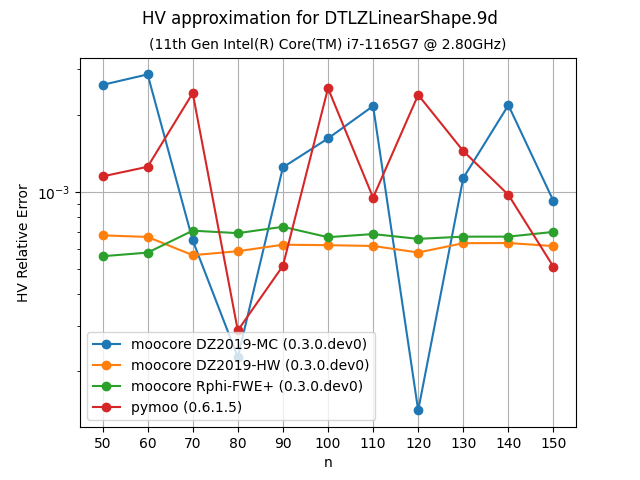
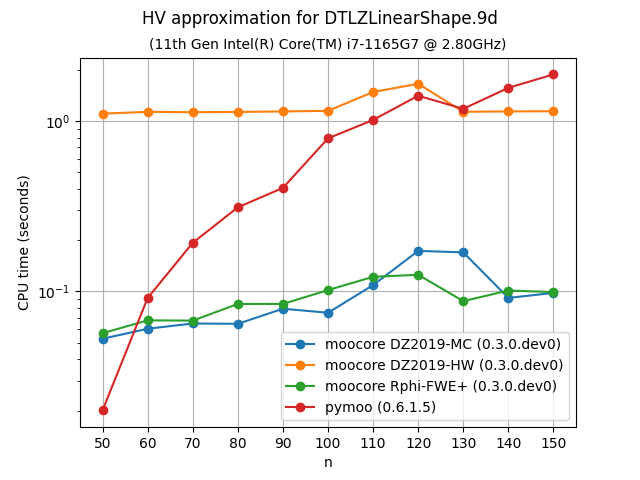
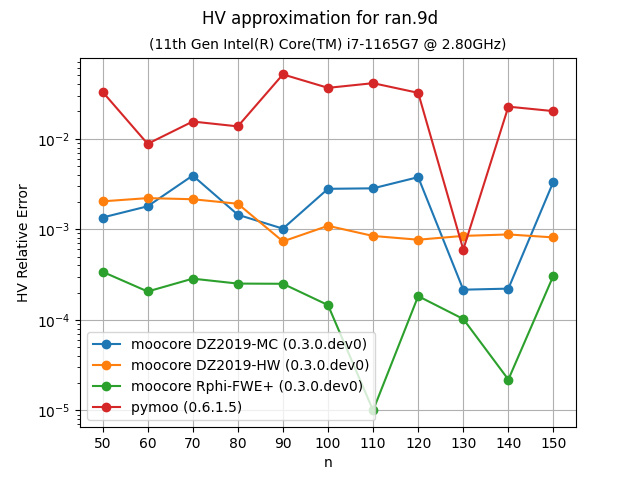
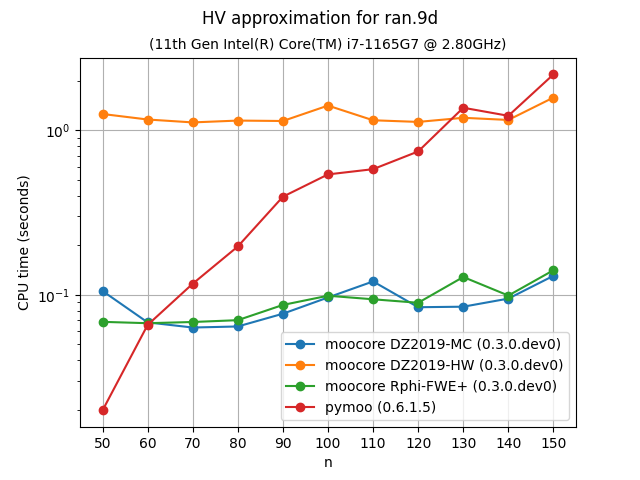
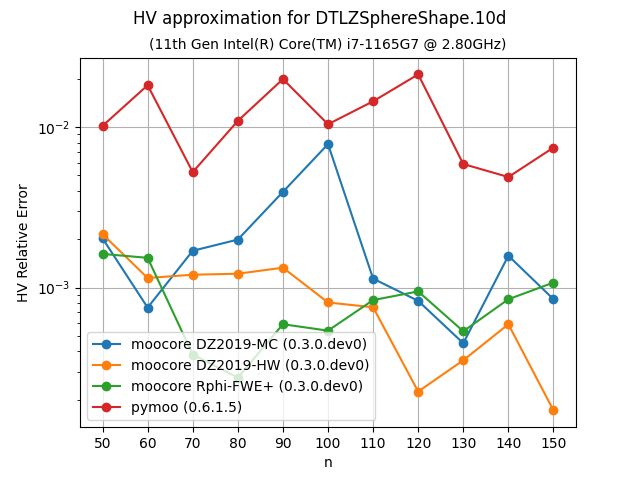
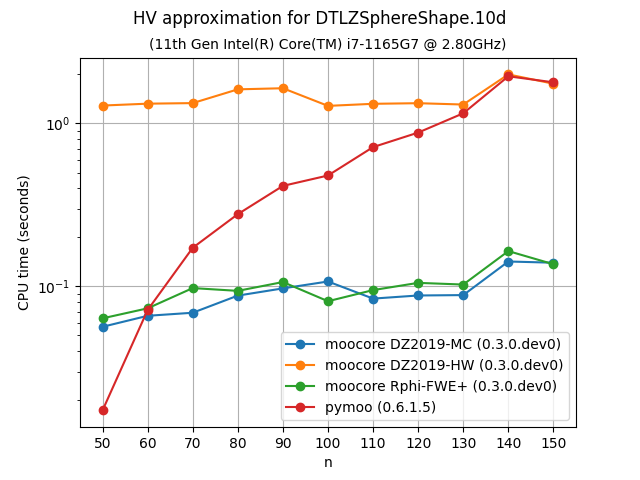
The following plots compare the accuracy and speed of approximating the
hypervolume with the various methods provided by moocore.hv_approx(). The
plots show that there is no clear winner, in terms of approximation error,
between methods Rphi-FWE+ (default) and DZ2019-HW, but both produce
consistently lower approximation errors than method DZ2019-MC. However, Rphi-FWE+ is as fast as DZ2019-MC and both are consistently faster than DZ2019-HW, in particular with higher number of objectives.
The exact computation of the hypervolume for less than 5D takes milliseconds for thousands of points, whereas approximating the hypervolume is significantly slower and, thus, not worth doing.
Approximating the hypervolume becomes more useful for dimensions higher than 5,
where the exact computation becomes noticeably slower with hundreds of points.
For such problems, method DZ2019-HW becomes significantly slower than
Rphi-FWE+.
Epsilon and IGD+ indicators#
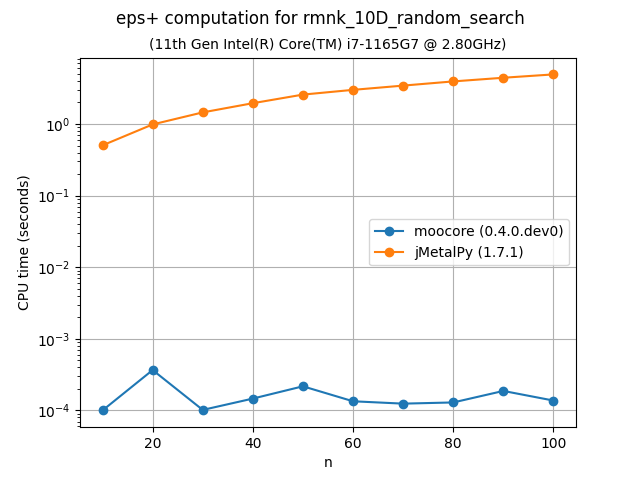
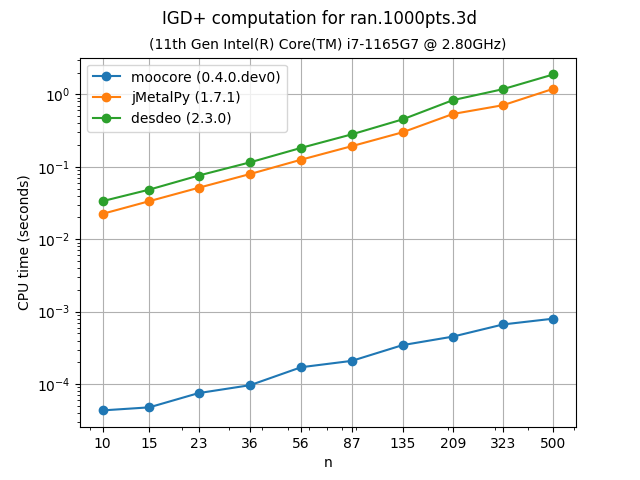
The following plots benchmark the speed of computing the epsilon indicator metric and IGD+ indicator. Although the algorithms for computing these metrics are relatively simple and easy to vectorize in Python, the moocore implementation is still 10 to 100 times faster.