hv_approx_fpras#
- moocore.hv_approx_fpras(points, /, ref, *, maximise=False, seed=None, epsilon=0.01, delta=0.1)[source]#
Approximate the hypervolume indicator via a fully polynomial-time randomized approximation scheme (FPRAS).
This function implements the approximation algorithm by Bringmann and Friedrich[1]. This FPRAS returns, with probability \((1 - \delta)\), an \(\epsilon\)-approximation of the hypervolume metric with respect to the given reference point, assuming minimization of all objectives by default.
Warning
Lower values of
epsilon(\(\epsilon\)) ordelta(\(\delta\)) require significantly longer computation time.See also
For details of the calculation, see the Notes section below.
- Parameters:
points (
ArrayLike) – Array of numerical values, where each row gives the coordinates of a point in objective space. If the array is created by theread_datasets()function, remove the last column.ref (
ArrayLike) – Reference point as a 1D vector. Must be either a single value, which will be used for all coordinates, or the same length as a single point inpoints.maximise (
bool|Sequence[bool], default:False) – Whether the objectives must be maximised instead of minimised. Either a single boolean value that applies to all objectives or a list of boolean values, with one value per objective. Also accepts a 1D numpy array with value 0/1 for each objective.seed (
int|Generator|None, default:None) – Either an integer to seednumpy.random.default_rng(), Numpy default random number generator (RNG) or an instance of a Numpy-compatible RNG.Noneuses the equivalent of a random seed, as innumpy.random.default_rng().epsilon (
float, default:0.01) – Desired relative error of the approximation, \(\epsilon > 0\).delta (
float, default:0.1) – Desired failure probability \(0 < \delta < 1\), \((1 - \delta)\) gives the confidence level.
- Returns:
float– A single numerical value, the approximate hypervolume indicator.
See also
Notes
This function computes an approximation \(\hat{v}\) of the true hypervolume \(v = \text{hyp}_r(A)\) of the input points in \(A \subset \mathbb{R}^m\) with respect to the reference point \(r \in \mathbb{R}^m\), such that
\[\text{Pr}[(1-\epsilon)v \leq \hat{v} \leq (1+\epsilon)v] \geq (1 - \delta)\]where \(\epsilon > 0\) and \(0 < \delta < 1\).
The algorithm requires \(O(\frac{nm}{\epsilon^2\log\delta})\). That is, it is linear on the number of points and dimensions, but quadratic in the approximation error. In other words, more accurate approximations require significantly more time.
In contrast to the (quasi)-Monte-Carlo methods provided by
hv_approx(), the presence of weakly-dominated points not only increases the runtime, but also changes the returned approximation for a fixed random seed.References
Examples
>>> x = np.array([[5, 5], [4, 6], [2, 7], [7, 4]])
>>> moocore.hypervolume(x, ref=[10, 10])
38.0
>>> moocore.hv_approx(x, ref=[10, 10], method="Rphi-FWE+")
37.99998
>>> moocore.hv_approx_fpras(x, ref=[10, 10], epsilon=0.1, delta=0.2, seed=42)
38.17619
>>> moocore.hv_approx_fpras(x, ref=[10, 10], epsilon=0.01, delta=0.2, seed=42)
38.08557
Contrary to
hv_approx(), the presence of dominated points not only increases the runtime, but also changes the output for the same random seed, so this:>>> x = moocore.get_dataset("input1.dat")[:, :-1] >>> moocore.hv_approx_fpras(x, ref=10, seed=42) 93.6140
does NOT give the same hypervolume approximation as this:
>>> x = moocore.filter_dominated(x)
>>> moocore.hv_approx_fpras(x, ref=10, seed=42)
93.5539
Gallery examples#
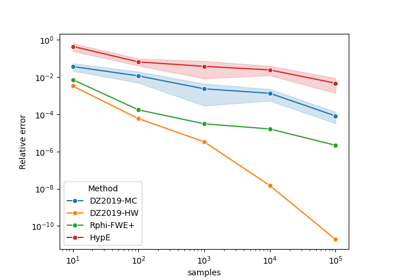
Comparing methods for approximating the hypervolume