Identify and remove dominated points according to Pareto optimality
Source:R/nondominated.R
nondominated.RdIdentify nondominated points with is_nondominated() and remove dominated
ones with filter_dominated().
any_dominated() quickly detects if a set contains any dominated point.
Usage
is_nondominated(x, maximise = FALSE, keep_weakly = FALSE)

filter_dominated(x, maximise = FALSE, keep_weakly = FALSE)

any_dominated(x, maximise = FALSE, keep_weakly = FALSE)
Arguments
- x
matrix()|data.frame()
Matrix or data frame of numerical values, where each row gives the coordinates of a point.- maximise
logical()
Whether the objectives must be maximised instead of minimised. Either a single logical value that applies to all objectives or a vector of logical values, with one value per objective.- keep_weakly
logical(1)
IfFALSE, returnFALSEfor any duplicates of nondominated points, except the last one.
Value
is_nondominated() returns a logical vector of the same length
as the number of rows of data, where TRUE means that the
point is not dominated by any other point.
filter_dominated() returns a matrix or data.frame with only mutually nondominated points.
any_dominated() returns TRUE if x contains any (weakly-)dominated points, FALSE otherwise.
Details
Given \(n\) points of dimension \(m\), the current implementation always
uses the best-known \(O(n \log n)\) dimension-sweep algorithm
(Kung et al. 1975)
for \(m \leq 3\). For \(m \geq 4\), functions
is_nondominated() and filter_dominated() use the best-known \(O(n
\log^{m-2} n)\) algorithm (Kung et al. 1975)
when \(n > 16\), and
the naive \(O(m n^2)\) algorithm otherwise. Function any_dominated()
always uses the naive algorithm for \(m \geq 4\).
References
H T Kung, F Luccio, F P Preparata (1975). “On Finding the Maxima of a Set of Vectors.” Journal of the ACM, 22(4), 469–476. doi:10.1145/321906.321910 .
Examples
S = matrix(c(1,1,0,1,1,0,1,0), ncol = 2, byrow = TRUE)
is_nondominated(S)
#> [1] FALSE TRUE TRUE FALSE
is_nondominated(S, maximise = TRUE)
#> [1] TRUE FALSE FALSE FALSE
filter_dominated(S)
#> [,1] [,2]
#> [1,] 0 1
#> [2,] 1 0
filter_dominated(S, keep_weakly = TRUE)
#> [,1] [,2]
#> [1,] 0 1
#> [2,] 1 0
#> [3,] 1 0
any_dominated(S)
#> [1] TRUE
any_dominated(S, keep_weakly = TRUE)
#> [1] TRUE
any_dominated(filter_dominated(S))
#> [1] FALSE
path_A1 <- file.path(system.file(package="moocore"),"extdata","ALG_1_dat.xz")
set <- read_datasets(path_A1)[,1:2]
is_nondom <- is_nondominated(set)
cat("There are ", sum(is_nondom), " nondominated points\n")
#> There are 583 nondominated points
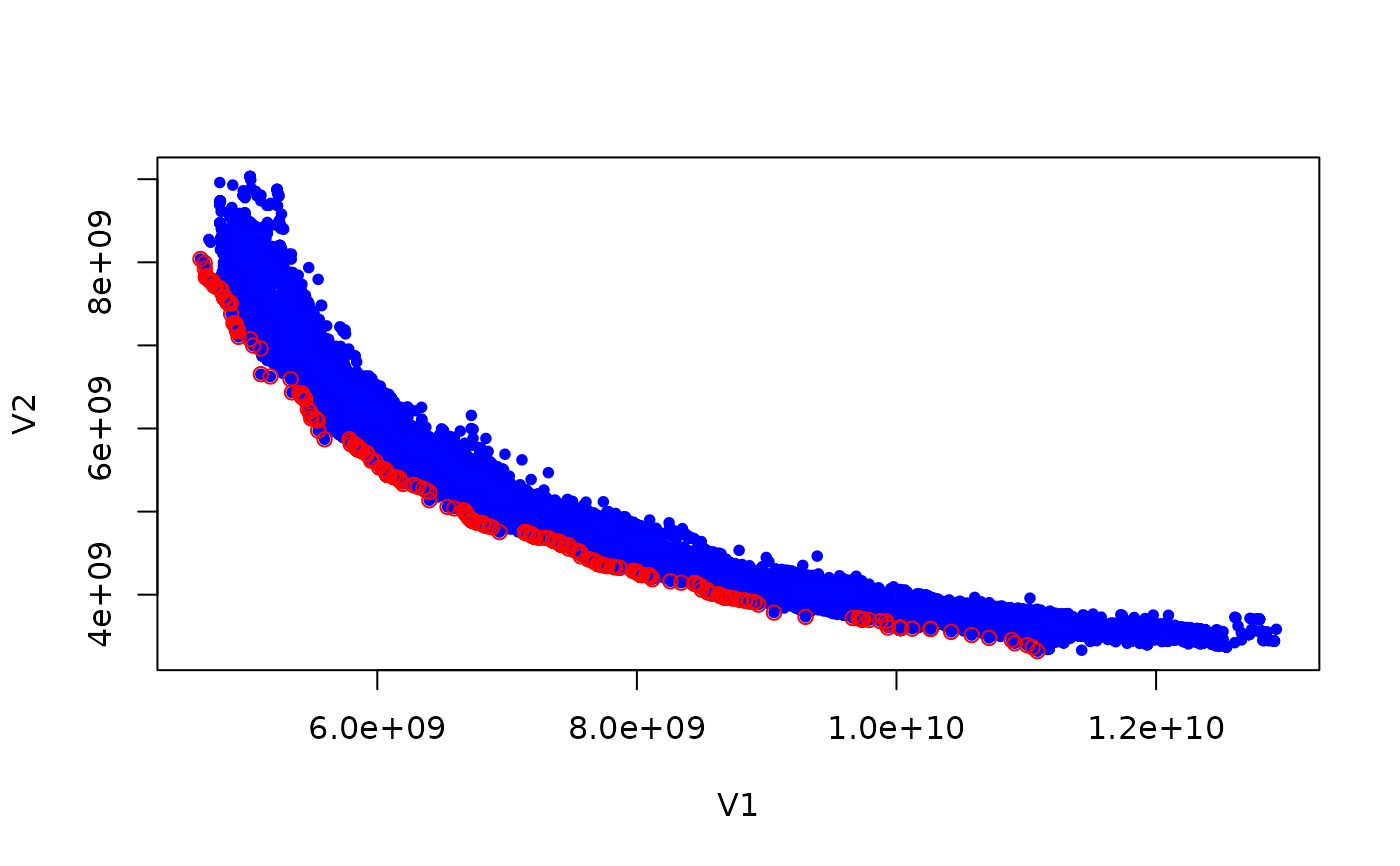
if (requireNamespace("graphics", quietly = TRUE)) {
plot(set, col = "blue", type = "p", pch = 20)
ndset <- filter_dominated(set)
points(ndset[order(ndset[,1]),], col = "red", pch = 21)
}