Interactively choose according to empirical attainment function differences
Source:R/interactive.R
choose_eafdiffplot.RdCreates the same plot as eafdiffplot() but waits for the user to click in
one of the sides. Then it returns the rectangles the give the differences in
favour of the chosen side. These rectangles may be used for interactive
decision-making as shown in Diaz and López-Ibáñez (2021)
. The function
moocore::choose_eafdiff() may be used in a non-interactive context.
Usage
choose_eafdiffplot(
  data_left,
  data_right,
  intervals = 5,
  maximise = c(FALSE, FALSE),
  title_left = deparse(substitute(data_left)),
  title_right = deparse(substitute(data_right)),
  ...
)
Arguments
- data_left, data_right
Data frames corresponding to the input data of left and right sides, respectively. Each data frame has at least three columns, the third one being the set of each point. See also
read_datasets().- intervals
(
integer(1)|character())
The absolute range of the differences \([0, 1]\) is partitioned into the number of intervals provided. If an integer is provided, then labels for each interval are computed automatically. If a character vector is provided, its length is taken as the number of intervals.- maximise
(
logical()|logical(1))
Whether the objectives must be maximised instead of minimised. Either a single logical value that applies to all objectives or a vector of logical values, with one value per objective.- title_left, title_right
Title for left and right panels, respectively.
- ...
Other graphical parameters are passed down to
eafdiffplot().
Value
matrix() where the first 4 columns give the coordinates of two
corners of each rectangle and the last column. In both cases, the last
column gives the positive differences in favor of the chosen side.
References
Juan Esteban Diaz, Manuel López-Ibáñez (2021). “Incorporating Decision-Maker's Preferences into the Automatic Configuration of Bi-Objective Optimisation Algorithms.” European Journal of Operational Research, 289(3), 1209–1222. doi:10.1016/j.ejor.2020.07.059 .
Examples
# \donttest{
library(moocore)
extdata_dir <- system.file(package="moocore", "extdata")
A1 <- read_datasets(file.path(extdata_dir, "wrots_l100w10_dat"))
A2 <- read_datasets(file.path(extdata_dir, "wrots_l10w100_dat"))
if (interactive()) {
rectangles <- choose_eafdiffplot(A1, A2, intervals = 5)
} else { # Choose A1
rectangles <- eafdiff(A1, A2, intervals = 5, rectangles = TRUE)
rectangles <- choose_eafdiff(rectangles, left = TRUE)
}
reference <- c(max(A1[, 1], A2[, 1]), max(A1[, 2], A2[, 2]))
x <- split.data.frame(A1[,1:2], A1[,3])
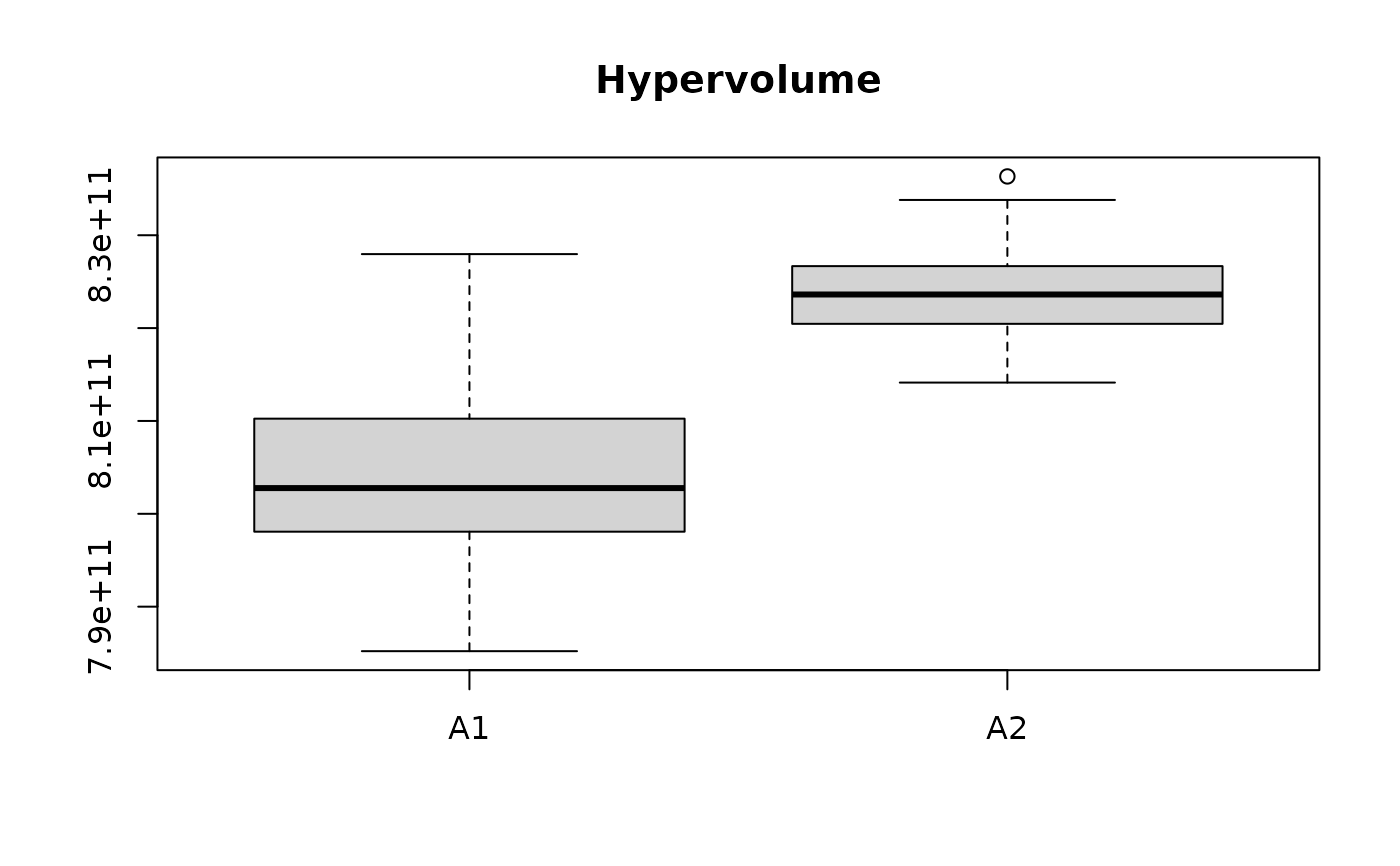
hv_A1 <- sapply(split.data.frame(A1[, 1:2], A1[, 3]),
hypervolume, reference=reference)
hv_A2 <- sapply(split.data.frame(A2[, 1:2], A2[, 3]),
hypervolume, reference=reference)
boxplot(list(A1=hv_A1, A2=hv_A2), main = "Hypervolume")
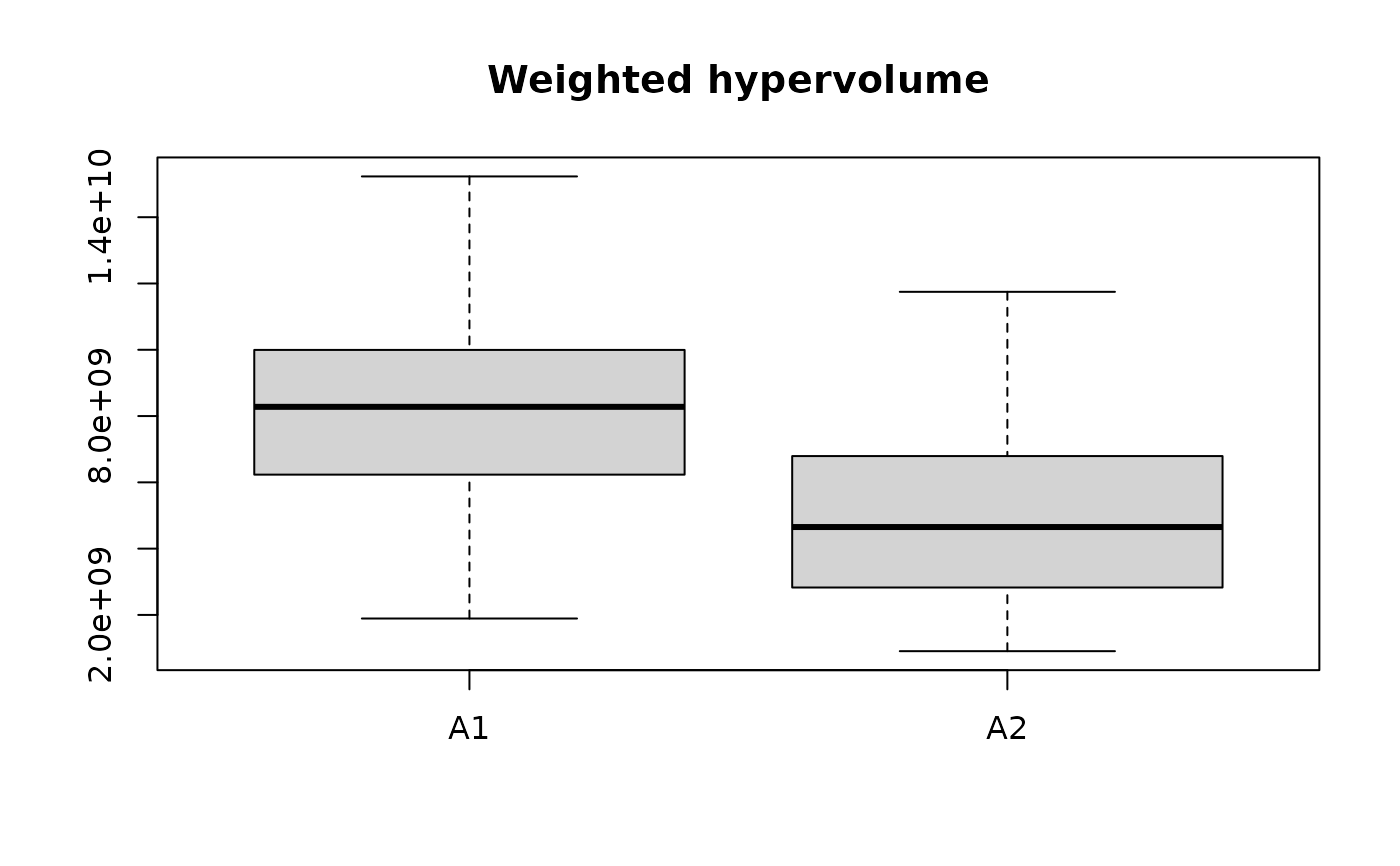
 whv_A1 <- sapply(split.data.frame(A1[, 1:2], A1[, 3]),
whv_rect, rectangles=rectangles, reference=reference)
whv_A2 <- sapply(split.data.frame(A2[, 1:2], A2[, 3]),
whv_rect, rectangles=rectangles, reference=reference)
boxplot(list(A1=whv_A1, A2=whv_A2), main = "Weighted hypervolume")
whv_A1 <- sapply(split.data.frame(A1[, 1:2], A1[, 3]),
whv_rect, rectangles=rectangles, reference=reference)
whv_A2 <- sapply(split.data.frame(A2[, 1:2], A2[, 3]),
whv_rect, rectangles=rectangles, reference=reference)
boxplot(list(A1=whv_A1, A2=whv_A2), main = "Weighted hypervolume")
 # }
# }