Note
Go to the end to download the full example code.
Computing Multi-Objective Quality Metrics#
Several examples of computing multi-objective unary quality metrics.
import numpy as np
import moocore
Comparing two multi-objective datasets using unary quality metrics#
First, read the datasets.
spherical = moocore.get_dataset("spherical-250-10-3d.txt.xz")
uniform = moocore.get_dataset("uniform-250-10-3d.txt.xz")

spherical_objs = spherical[:, :-1]
spherical_sets = spherical[:, -1]
uniform_objs = uniform[:, :-1] / 10
uniform_sets = uniform[:, -1]
Create reference set and reference point.
ref_set = moocore.filter_dominated(np.vstack((spherical_objs, uniform_objs)))
ref_point = 1.1
Calculate metrics.
uniform_igd_plus = moocore.apply_within_sets(
    uniform_objs, uniform_sets, moocore.igd_plus, ref=ref_set
)
spherical_igd_plus = moocore.apply_within_sets(
    spherical_objs, spherical_sets, moocore.igd_plus, ref=ref_set
)

uniform_epsilon = moocore.apply_within_sets(
    uniform_objs, uniform_sets, moocore.epsilon_mult, ref=ref_set
)
spherical_epsilon = moocore.apply_within_sets(
    spherical_objs, spherical_sets, moocore.epsilon_mult, ref=ref_set
)

uniform_hypervolume = moocore.apply_within_sets(
    uniform_objs, uniform_sets, moocore.hypervolume, ref=ref_point
)
spherical_hypervolume = moocore.apply_within_sets(
    spherical_objs, spherical_sets, moocore.hypervolume, ref=ref_point
)

print(f"""
            Uniform       Spherical
            -------       ---------
Mean HV  :  {np.mean(uniform_hypervolume):.5f}       {np.mean(spherical_hypervolume):.5f}
Mean IGD+:  {np.mean(uniform_igd_plus):.5f}       {np.mean(spherical_igd_plus):.5f}
Mean eps*:  {np.mean(uniform_epsilon):.3f}       {np.mean(spherical_epsilon):.3f}

""")
            Uniform       Spherical
            -------       ---------
Mean HV  :  0.78689       0.73290
Mean IGD+:  0.12383       0.15745
Mean eps*:  623.278       225.916
IGD and Average Hausdorff are not Pareto-compliant#
Example 4 by Ishibuchi et al.[1] shows a case where IGD gives the wrong answer.
Assuming minimization of both objectives, A is better than B in terms of Pareto optimality.
import pandas as pd
import matplotlib.pyplot as plt
import seaborn as sns

sns.set_theme()

df = pd.concat(
    [
        pd.DataFrame({"f1": x[:, 0], "f2": x[:, 1], "Set": label})
        for x, label in zip([ref, A, B], ["Ref", "A", "B"])
    ],
    ignore_index=True,
)
ax = sns.scatterplot(data=df, x="f1", y="f2", style="Set", hue="Set", s=200)
plt.show()
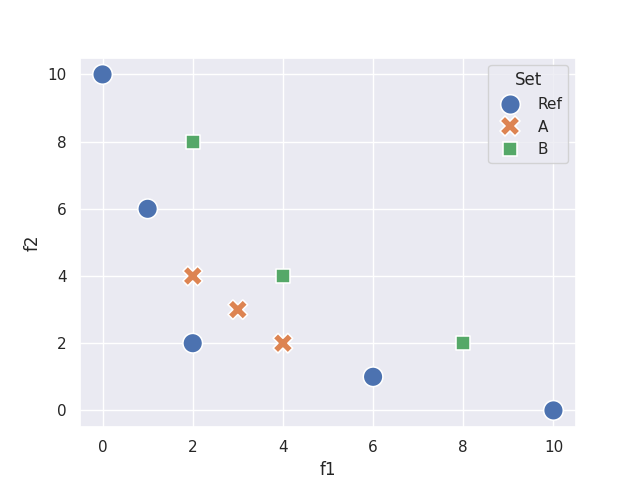
However, both moocore.igd() and moocore.avg_hausdorff_dist()
incorrectly measure B as better than A, whereas moocore.igd_plus(),
moocore.r2_exact() and moocore.hypervolume() correctly measure A
as better than B (remember that hypervolume must be maximized) and
moocore.epsilon_additive() measures both as equally good
(epsilon is weakly Pareto compliant).
pd.DataFrame(
    dict(
        A=[
            moocore.igd(A, ref),
            moocore.avg_hausdorff_dist(A, ref),
            moocore.igd_plus(A, ref),
            moocore.epsilon_additive(A, ref),
            moocore.hypervolume(A, ref=10),
            moocore.r2_exact(A, ref=0),
        ],
        B=[
            moocore.igd(B, ref),
            moocore.avg_hausdorff_dist(B, ref),
            moocore.igd_plus(B, ref),
            moocore.epsilon_additive(B, ref),
            moocore.hypervolume(B, ref=10),
            moocore.r2_exact(B, ref=0),
        ],
    ),
    index=["IGD", "Hausdorff", "IGD+", "eps+", "HV", "Exact R2"],
)
Total running time of the script: (0 minutes 0.269 seconds)