hypervolume#
- moocore.hypervolume(points, /, ref, *, maximise=False)[source]#
Hypervolume indicator.
Compute the hypervolume metric with respect to a given reference point assuming minimization of all objectives.
See also
For details about the hypervolume, see Hypervolume metric.
- Parameters:
points (
ArrayLike) – Array of numerical values, where each row gives the coordinates of a point in objective space. If the array is created by theread_datasets()function, remove the last column.ref (
ArrayLike) – Reference point as a 1D vector. Must be either a single value, which will be used for all coordinates, or the same length as a single point inpoints.maximise (
bool|Sequence[bool], default:False) – Whether the objectives must be maximised instead of minimised. Either a single boolean value that applies to all objectives or a list of boolean values, with one value per objective. Also accepts a 1D numpy array with value 0/1 for each objective.
- Returns:
float– A single numerical value, the hypervolume indicator.
See also
HypervolumeObject-oriented interface.
RelativeHypervolumeCompute hypervolume relative to a reference set.
hv_contributionsHypervolume contribution of individual points.
Notes
For 2D and 3D, the algorithms used [1][2] have \(O(n \log n)\) complexity, where \(n\) is the number of input points. The 3D case uses the HV3D+ algorithm [3], which has the same complexity as the HV3D algorithm [1][2], but it is faster in practice.
For 4D, the algorithm used is HV4D+ [3], which has \(O(n^2)\) complexity. Compared to the original implementation, this implementation correctly handles weakly dominated points and has been further optimized for speed.
For 5D or higher and up to 12 points, the implementation uses the inclusion-exclusion algorithm [4], which has \(O(m 2^{n})\) time and \(O(n\cdot m)\) space complexity, where \(m\) is the dimension of the points, but it is very fast for such small sets. For larger number of points, it uses a recursive algorithm [1] that computes 4D contributions [3] as the base case, resulting in a \(O(n^{m-2})\) time complexity and \(O(n)\) space complexity in the worst-case. Experimental results show that the pruning techniques used may reduce the time complexity even further. The original proposal [1] had the HV3D algorithm as the base case, giving a time complexity of \(O(n^{m-2} \log n)\). Andreia P. Guerreiro enhanced the numerical stability of the recursive algorithm by avoiding floating-point comparisons of partial hypervolumes.
The hypervolume of 1D inputs is defined as
max(0, ref - points.min()).References
Examples
>>> dat = np.array([[5, 5], [4, 6], [2, 7], [7, 4]])
>>> moocore.hypervolume(dat, ref=[10, 10])
38.0
This function assumes that objectives must be minimized by default. We can easily specify maximization:
>>> moocore.hypervolume(dat, ref=0, maximise=True)
39.0
Merge all the sets of a dataset by removing the set number column:
>>> dat = moocore.get_dataset("input1.dat")[:, :-1]
>>> len(dat)
100
Dominated points are ignored, so this:
>>> moocore.hypervolume(dat, ref=[10, 10])
93.55331425585321
gives the same hypervolume as this:
>>> dat = moocore.filter_dominated(dat)
>>> len(dat)
6
>>> moocore.hypervolume(dat, ref=[10, 10])
93.55331425585321
Gallery examples#
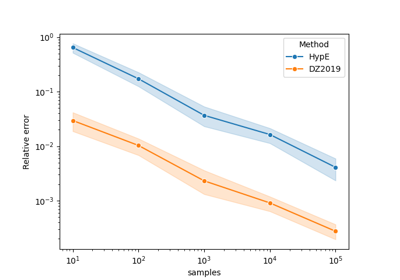
Comparing methods for approximating the hypervolume